System Architecture
Overview of the global layered architecture:
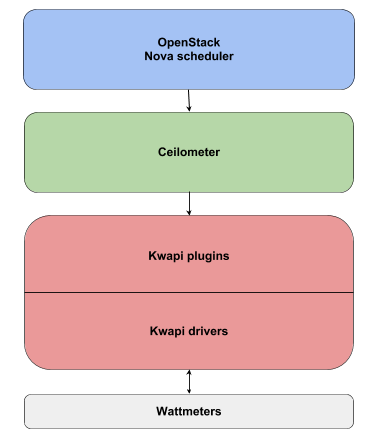
Kwapi drivers
Kwapi supports different kinds of wattmeters (IPMI, Eaton PDU, Wattsup, etc). Wattmeters communicate via IP networks or serial links. Each wattmeter has one or more sensors (probes). Wattmeters send their values quite often (each second), and they are listen by wattmeter drivers. Wattmeter drivers are derived from a Driver superclass, itself derived from Thread. So drivers are threads. At least one driver thread is instantiated for each wattmeter. Their constructors takes as arguments a list of probe IDs, and kwargs (specific arguments).
Driver threads roles are:
- Setting up wattmeter.
- Listening and decoding received data.
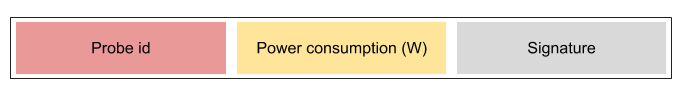
- Calling a driver superclass method with measurements as argument. This method appends signature to the measurements, and publishes them on the bus.
Message format:
Driver manager
The driver manager is the loader and the checker of driver threads. It loads all drivers according the configuration file, and checks regularly that driver threads are alive. In case of crash, the event is logged and the driver thread is reloaded. We can imagine that a driver will crash if a technician unplug a wattmeter, for example.
Bus
Currently, the internal Kwapi bus is ZeroMQ. Publishers are driver threads, and subscribers are plugins.
Kwapi plugins
Kwapi API plugin
API plugin allows Ceilometer pollster to get consumption data through a REST API. This plugin contains a collector that computes kWh, and an API based on Flask.
Collector
The collector stores these values for each probe:
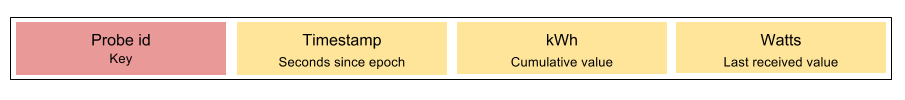
- Fields:
- Probe id: could be the hostname of the monitored machine. But it is a bit more complicated because a probe can monitor several machines (PDU).
- Timestamp: is updated when a new value is received.
- KWh: is computed by taking into account the new watt value, and the elapsed time since the previous update. It allows Ceilometer to compute average consumption for a given duration (knowing the kWh consumed and the time elapsed since its last check).
- Watts: offers the possibility to know instantaneous consumption of a device, without having to query two times a probe in a small interval to deduce it. This could be especially useful if a probe has a large refresh interval: there is no need to wait its next value.
No history is kept because Ceilometer already has a storage architecture. The collector is cleaned periodically to prevent a deleted probe from being stored indefinitely in the collector. So when a probe has not been updated for a long time, it is deleted.
API
| Verb | URL | Parameters | Expected result |
|---|---|---|---|
| GET | /v1/ | Returns detailed information about this specific version of the API. | |
| GET | /v1/probe-ids/ | Returns all known probe IDs. | |
| GET | /v1/probes/ | Returns all information about all known probes. | |
| GET | /v1/probes/<probe>/ | probe id | Returns all information about this probe (id, timestamp, kWh, W). |
| GET | /v1/probes/<probe>/<meter>/ | probe id, meter { timestamp, kwh, w } | Returns the probe meter value. |
Authentication
The pollster provides a token (X-Auth-Token). The API plugin checks the token (Keystone request), and if the token is valid, requested data are sent. Responses are not signed because Ceilometer trusts Kwapi plugin.
Ceilometer pollster
The API plugin is queried by a Ceilometer pollster. The Ceilometer pollster is started periodically by Ceilometer central agent. It knows the Kwapi URL by doing a Keystone request (endpoint-get). It queries probe values through Kwapi API, using the GET /v1/probes/ call, so that it gets all detailed informations about all probes in just one query. For each probe, it creates a counter object and publishes it on the Ceilometer bus.
- Published counters:
- Energy (cumulative type): represents kWh.
- Power (gauge type): represents watts.
Counter timestamps are Kwapi timestamps, so that Ceilometer doesn’t store wrong data if a probe is not updated. Ceilometer handles correctly the case where a probe value is reset (kWh decrease), because of its cumulative type.
Kwapi RRD plugin
Web interface
The visualization plugin provides a web interface with power consumption graphs. It is based on Flask and RRDtool.
| Verb | URL | Parameters | Expected result |
|---|---|---|---|
| GET | /last/<period>/ | period { minute, hour, day, week, month, year } | Returns a webpage with a summary graph and all probe graphs. |
| GET | /probe/<probe>/ | probe id | Returns a webpage with all graphs about this probe (all periods). |
| GET | /graph/<period>/ | period { minute, hour, day, week, month, year } | Returns a summary graph about this period. |
| GET | /graph/<period>/<probe>/ | period { minute, hour, day, week, month, year }, probe id | Returns a graph about this probe. |
Webpage with a summary graph and all probe graphs:
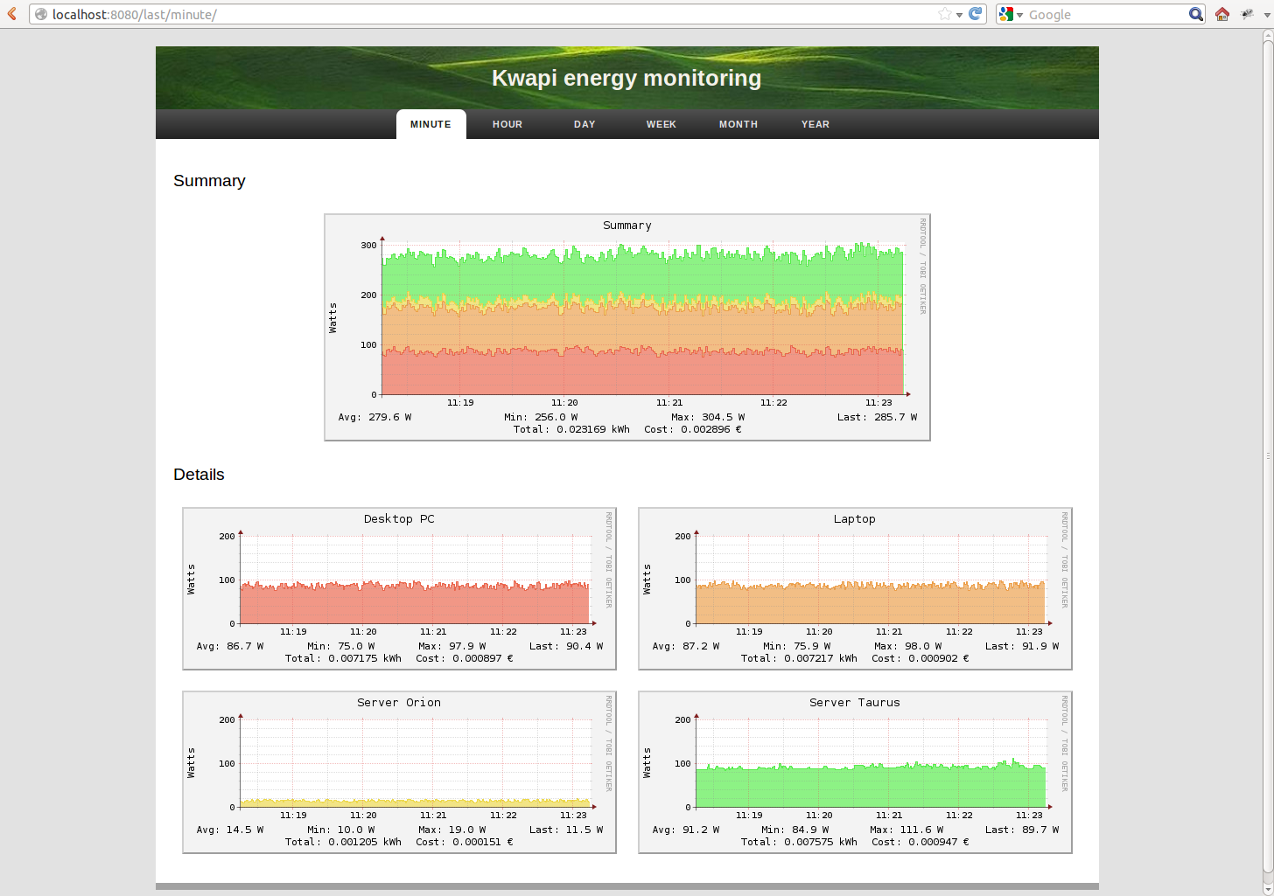
In the menu bar, you can choose the period for which you want to display graphs (last minutes, hour, day, week, month or year). By clicking on a probe, you can display all graphs available for this probe, with different resolutions.
Graphs
The summary graph shows the total power consumption (sum of all the probes). Each colour corresponds to a probe.
- The legend contains:
- Minimum, maximum, average and last power consumption.
- Energy consumed (kWh).
- Cost.
- File sizes:
- RRD file: 10 Ko.
- Probe graph: 12 Ko.
- Summary graph: 24 Ko.
A cache mechanism prevents graphs from being rebuilt uselessly.
Kwapi forwarder
The forwarder aims at decreasing the network traffic: if multiple plugins listen the same probe, the metric is sent once on the network, and the forwarder duplicate it and sends a copy to each listeners. The forwarder can also be installed on a gateway machine, in order to connect isolated networks.
The following diagram shows these two features:
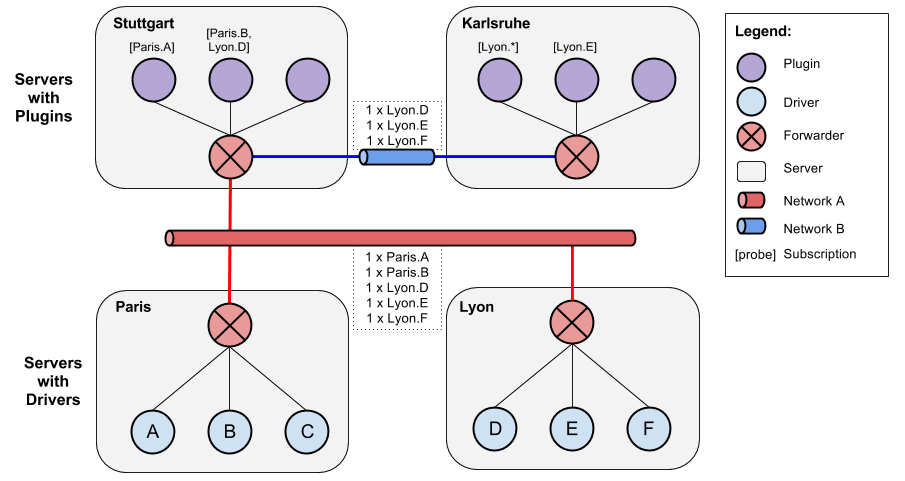
Using the forwarder is optional, and the plugins can be configured to subscribe directly to the drivers. Direct subscribing without using the forwarder is recommanded if the drivers and the plugins are running on the same machine.